
Data-driven video
Design one layer, and let your data make the rest. Repeat turns a single layer into one copy per row of a spreadsheet, and bindings let any property — the text, the width, the colour, even the timing — follow a formula. Change the data and the video changes with it: the count, content, layout and motion all update on their own.
You never write code. Formulas look like the ones you already know from spreadsheets:
= row.revenue / MAX($rows, 'revenue') * 600That’s a bar whose width is its share of the biggest value. Everything else in this guide builds on that one idea.
Quick start: a chart in three steps
Section titled “Quick start: a chart in three steps”- Upload a CSV. Drag it into the project’s assets view — Mixture detects it as a dataset automatically.
- Set a layer’s Repeat source to it. Draw a rectangle, right-click it, choose Repeat…, then set Source to Data rows and pick your file. One rectangle becomes one per row.
- Bind content and width. Hover a field in the properties panel, click the ƒ dot that appears, and pick a column. Bind a text layer’s content to the name column and the rectangle’s width to the number column — you have a bar chart.
The editor walkthrough covers every one of these clicks with the exact panels and buttons.
Repeat — one layer becomes many
Section titled “Repeat — one layer becomes many”Any layer can carry a repeat: a shape, a text layer, an image, even a saved component. The layer you design is the template, and Mixture replaces it with the copies — they behave exactly like layers you placed by hand.
The count comes from one of three places:
- Fixed count — you type a number. Twelve squares, ten numbers, eight dots.
- Data rows — a dataset decides. Five rows in the file, five copies on the canvas. Add a row and a sixth appears.
- Transcript words — a video or audio clip’s transcript decides: one copy per spoken word, already timed. More on this below.
Each copy can be offset in space (a pixel step per copy — how a column of bars or a grid of dots is laid out) and in time (a stagger, so copies appear one after another). For time, “Offset each” spaces copies a fixed gap apart, while “Fit into” divides a total duration among however many copies the data produces — handy when you don’t know the count in advance.
There’s also an On screen choice: copies can all stay once they appear (the default), show one at a time — each copy hides exactly as the next appears, which is how countdowns and line-by-line reveals work — or roll through a window of a few at once.
For the curious: what a repeat looks like in the project JSON
Twelve squares from one, each 110 px along and 0.06 s after the last:
{ "id": "square", "type": "rect", "x": 100, "y": 300, "width": 90, "height": 90, "fill": "#2f4bd8", "repeat": { "count": 12, "stagger": { "x": 110, "each": 0.06 } }}Swap count for a from and the data decides instead:
"repeat": { "from": "asset://<dataset-id>", "as": "row" }as names the row for formulas — row.revenue, row.name, and so on.
Bindings — properties that follow the data
Section titled “Bindings — properties that follow the data”A binding attaches a formula to a property. Each copy evaluates the formula with its own row, so one formula styles every copy differently:
width = row.revenue / MAX($rows, 'revenue') * 600fill = IF(row.delta >= 0, '#1c7a55', '#ba2f37')The first scales each bar to its share of the largest value on screen. The
second colours growth green and decline red. Text works the same way — bind a
layer’s content to row.name and every copy labels itself.
A few names are always available inside a formula:
| Name | Meaning |
|---|---|
row.… |
The copy’s own row (whatever you named it) |
$rows |
All the rows on screen — for MAX, SUM, averages |
$i |
Which copy this is, counting from 0 |
$count |
How many copies there are |
$i and $count mean you don’t even need data for some tricks: a countdown
is just = $count - $i on a repeated text layer.
Formulas are forgiving. If one breaks, the copy falls back to the value you designed — you get your original layer back, not a hole in the video. And whole-value formulas keep their type: a number stays a number, so it can drive geometry like width and position.
The row pipeline — filter, sort, top
Section titled “The row pipeline — filter, sort, top”Between the data and the copies sits an optional pipeline of small steps, run in order:
- filter — keep only the rows that match (
row.region = 'EMEA') - sort — order them (
revenue, descending) - top — keep the first N
- rank — stamp each surviving row with its position (1, 2, 3…), so a
label can read
#1 Acmewithout the data knowing its own order
Order matters, and that’s the point: top before sort means “the first
eight, then order them”; after means “the top eight”. Aggregates like
MAX($rows, 'revenue') see the rows after the pipeline — so a filtered
chart scales to the values actually on screen.
If a filter matches nothing, you get zero copies — a normal outcome, not an error.
Datasets — what you can upload
Section titled “Datasets — what you can upload”A dataset is a file of rows: CSV, TSV, JSON, or JSONL, up to 8 MB. Upload it to the project’s assets (or straight from the Repeat panel) and Mixture types the values for you on the way in:
"1,234","£1,234"and"12%"become numbers (a percent becomes 0.12)"true"/"false"become real booleans- blanks become empty — skipped by sums and averages, not counted as zero
For JSON files whose rows are nested inside the document — a typical API
export like { "data": { "results": [ … ] } } — a Path field walks down
to them: data.results.
One honest caveat: dates like 03/04/2026 are ambiguous (March 4th or April
3rd, depending on where you live), so Mixture deliberately leaves them as
text rather than guessing. Use ISO format (2026-03-04) if you need dates to
sort correctly.
Captions from a transcript
Section titled “Captions from a transcript”Transcribed video or audio unlocks the best trick in the system. Set a text layer’s Repeat source to Transcript words and pick the clip: the layer repeats over the spoken words, one copy per word, each already carrying that word’s start and end time.
Because the repeat is tied to the clip, the captions follow your edit. Cut a rambling sentence out of the video and its words disappear from the captions. Speed a section up and its words read faster. Move a cut and the captions re-time themselves — you never redo caption timing after an edit.
Style the one template layer — font, size, colour, position, entrance — and every word inherits it. See the caption patterns below for the popular treatments.
Timing per row
Section titled “Timing per row”startTime and endTime are bindable like anything else, and that’s what
makes per-row timing work. The karaoke pattern is three bindings on one text
layer repeated over word rows:
content = w.wordstartTime = w.startendTime = w.endEach copy exists exactly while its word is spoken, so the screen always shows
the word being said. Bind startTime but not endTime and words appear
and stay — a line that builds up word by word.
Showcase
Section titled “Showcase”Real patterns, each one built from a single designed layer. Every example here comes from a working demo project.
Leaderboard bar chart
Section titled “Leaderboard bar chart”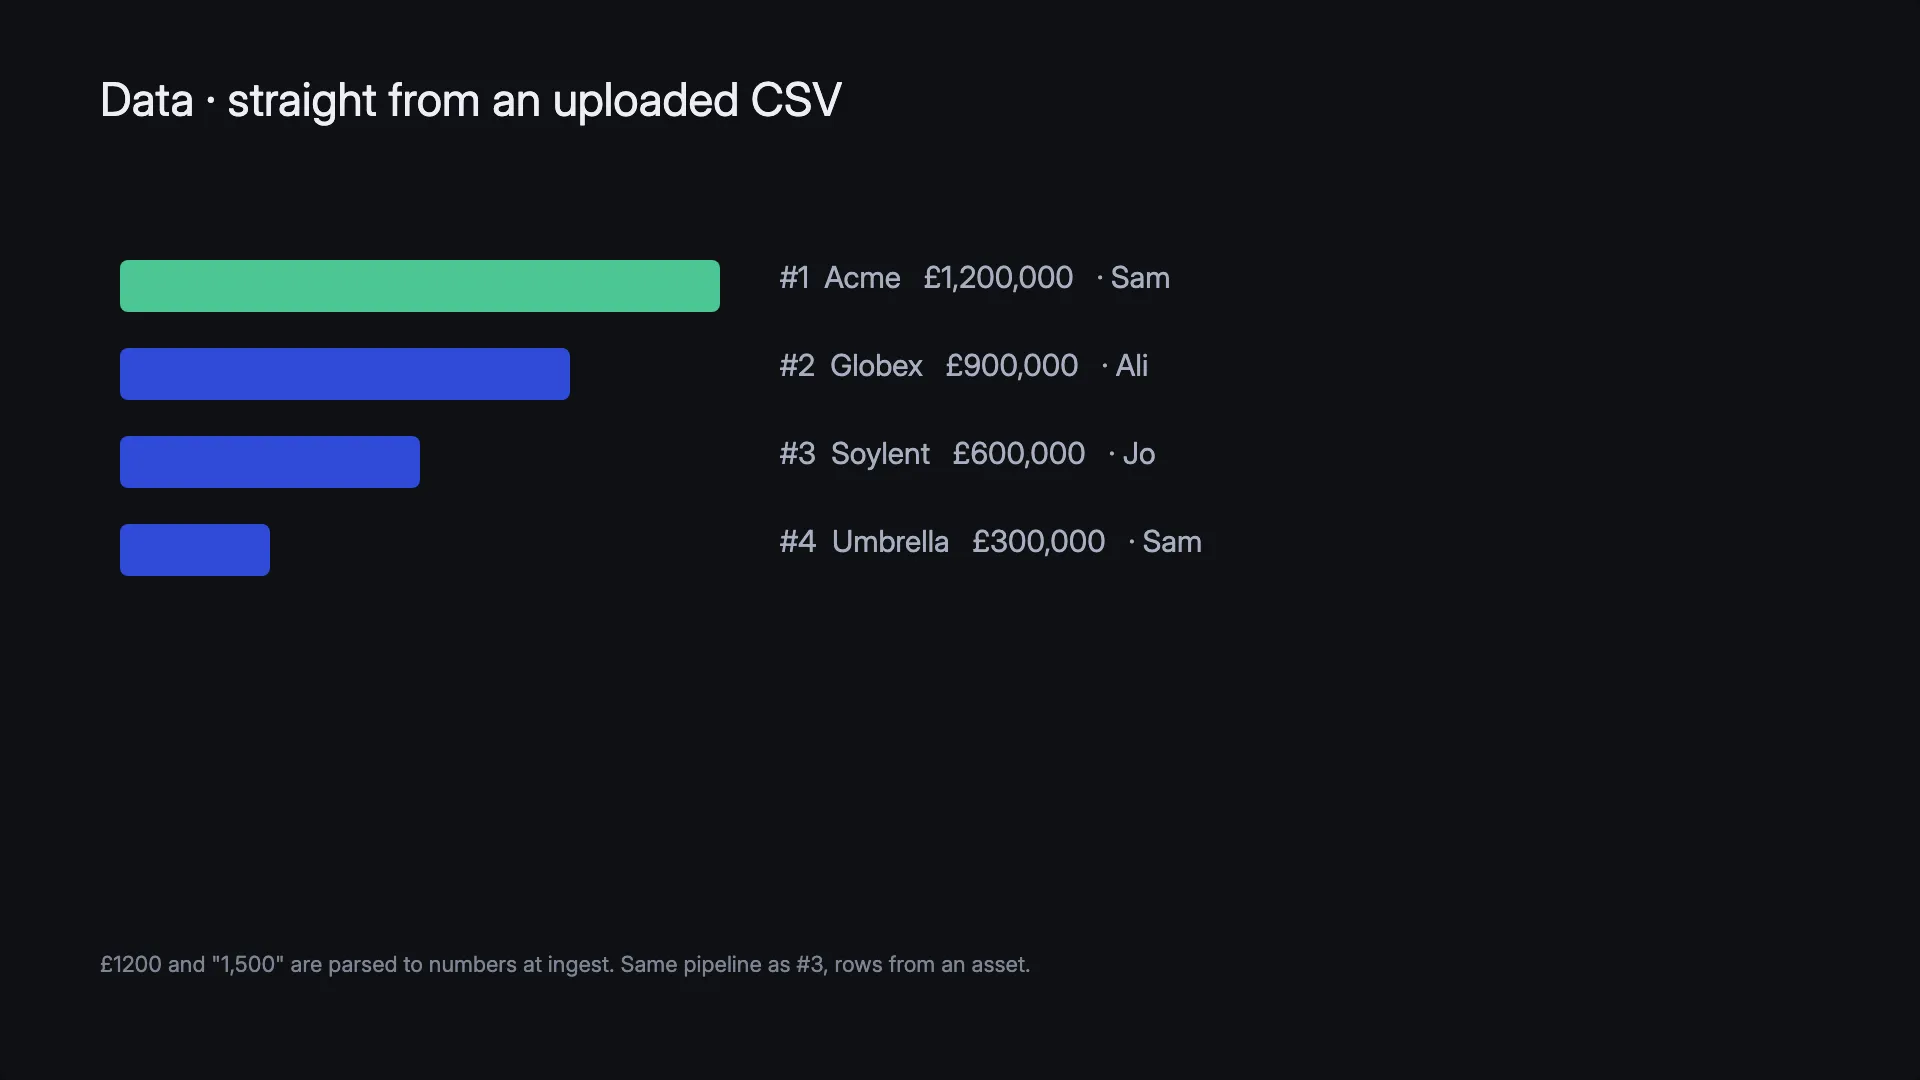
One rectangle plus one text label, repeated over a sales CSV. The pipeline keeps one region, sorts by revenue, takes the top four and ranks them; the bindings size each bar to its share of the winner and colour the leader.
The JSON behind it
{ "id": "bar", "type": "rect", "x": 120, "y": 260, "width": 40, "height": 52, "cornerRadius": 8, "repeat": { "from": "asset://<sales-csv>", "as": "row", "table": [ { "filter": "row.region = 'EMEA'" }, { "sort": { "by": "revenue", "desc": true } }, { "top": 4 }, { "rank": "position" } ], "stagger": { "y": 88, "fitInto": 1 } }, "bindings": { "width": "= row.revenue / MAX($rows, 'revenue') * 600", "fill": "= IF(row.position = 1, '#4cc794', '#2f4bd8')" }}The label layer repeats over the same rows and binds its content:
"bindings": { "content": "= '#' & row.position & ' ' & row.name & ' ' & CURRENCY(row.revenue * 1000, 'GBP', 'en-GB')"}& joins text, exactly as in a spreadsheet.
Per-word captions
Section titled “Per-word captions”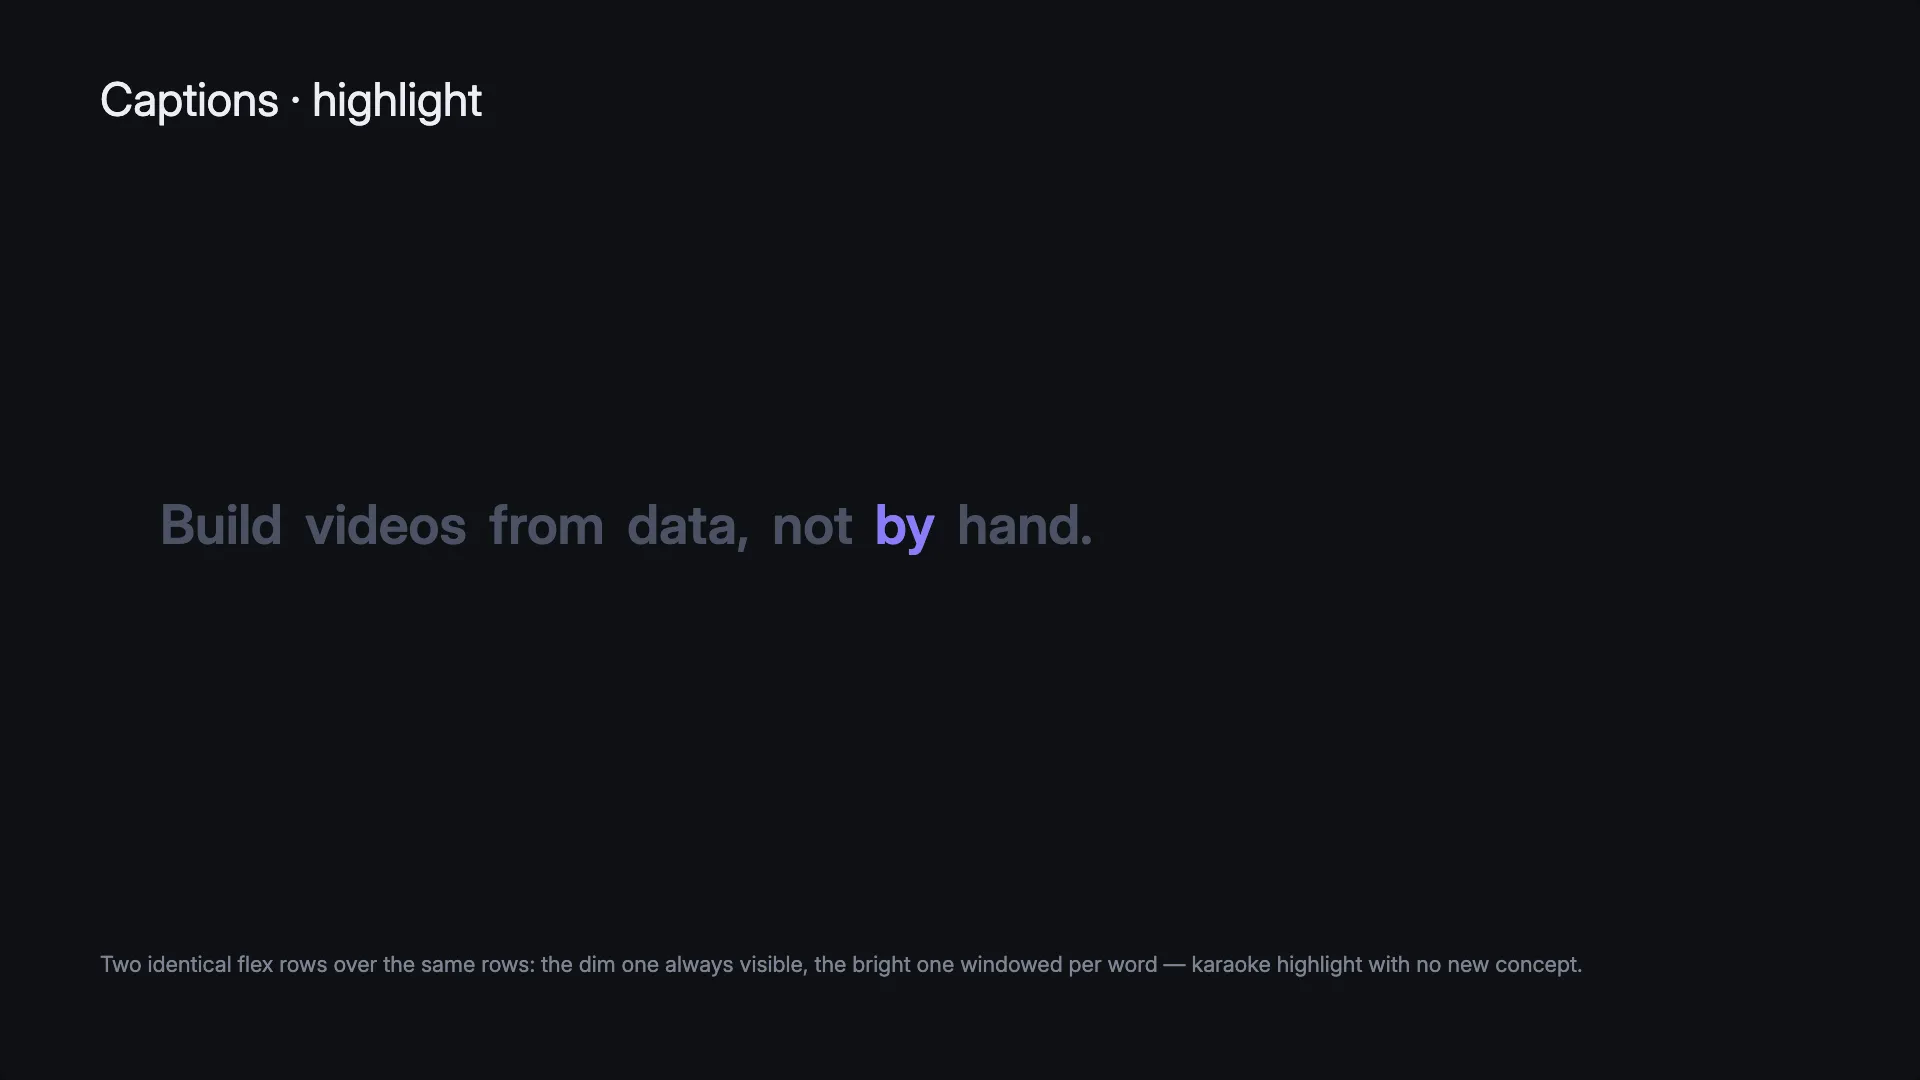
One big centred text layer repeated over word rows, with content,
startTime and endTime bound — each word owns the screen for exactly as
long as it’s spoken. Add a quick 0.12 s scale-up entrance to the template and
every word punches in. With a transcript source, the rows come straight from
the clip and follow its cuts.
The JSON behind it
{ "type": "text", "x": 960, "y": 540, "fontSize": 170, "fontWeight": 700, "textColor": "#ffffff", "repeat": { "from": [ { "word": "Build", "start": 0.2, "end": 0.5 }, { "word": "videos", "start": 0.5, "end": 0.92 }, { "word": "from", "start": 0.92, "end": 1.15 }, { "word": "data,", "start": 1.15, "end": 1.65 } ], "as": "w" }, "bindings": { "content": "= w.word", "startTime": "= w.start", "endTime": "= w.end" }}For a real clip, replace the inline rows with the transcript:
"repeat": { "from": "transcript://<clip-asset-id>", "as": "w", "syncTo": "<video-layer-id>" }syncTo is what makes the words follow the clip’s cuts and speed changes.
Two-font emphasis
Section titled “Two-font emphasis”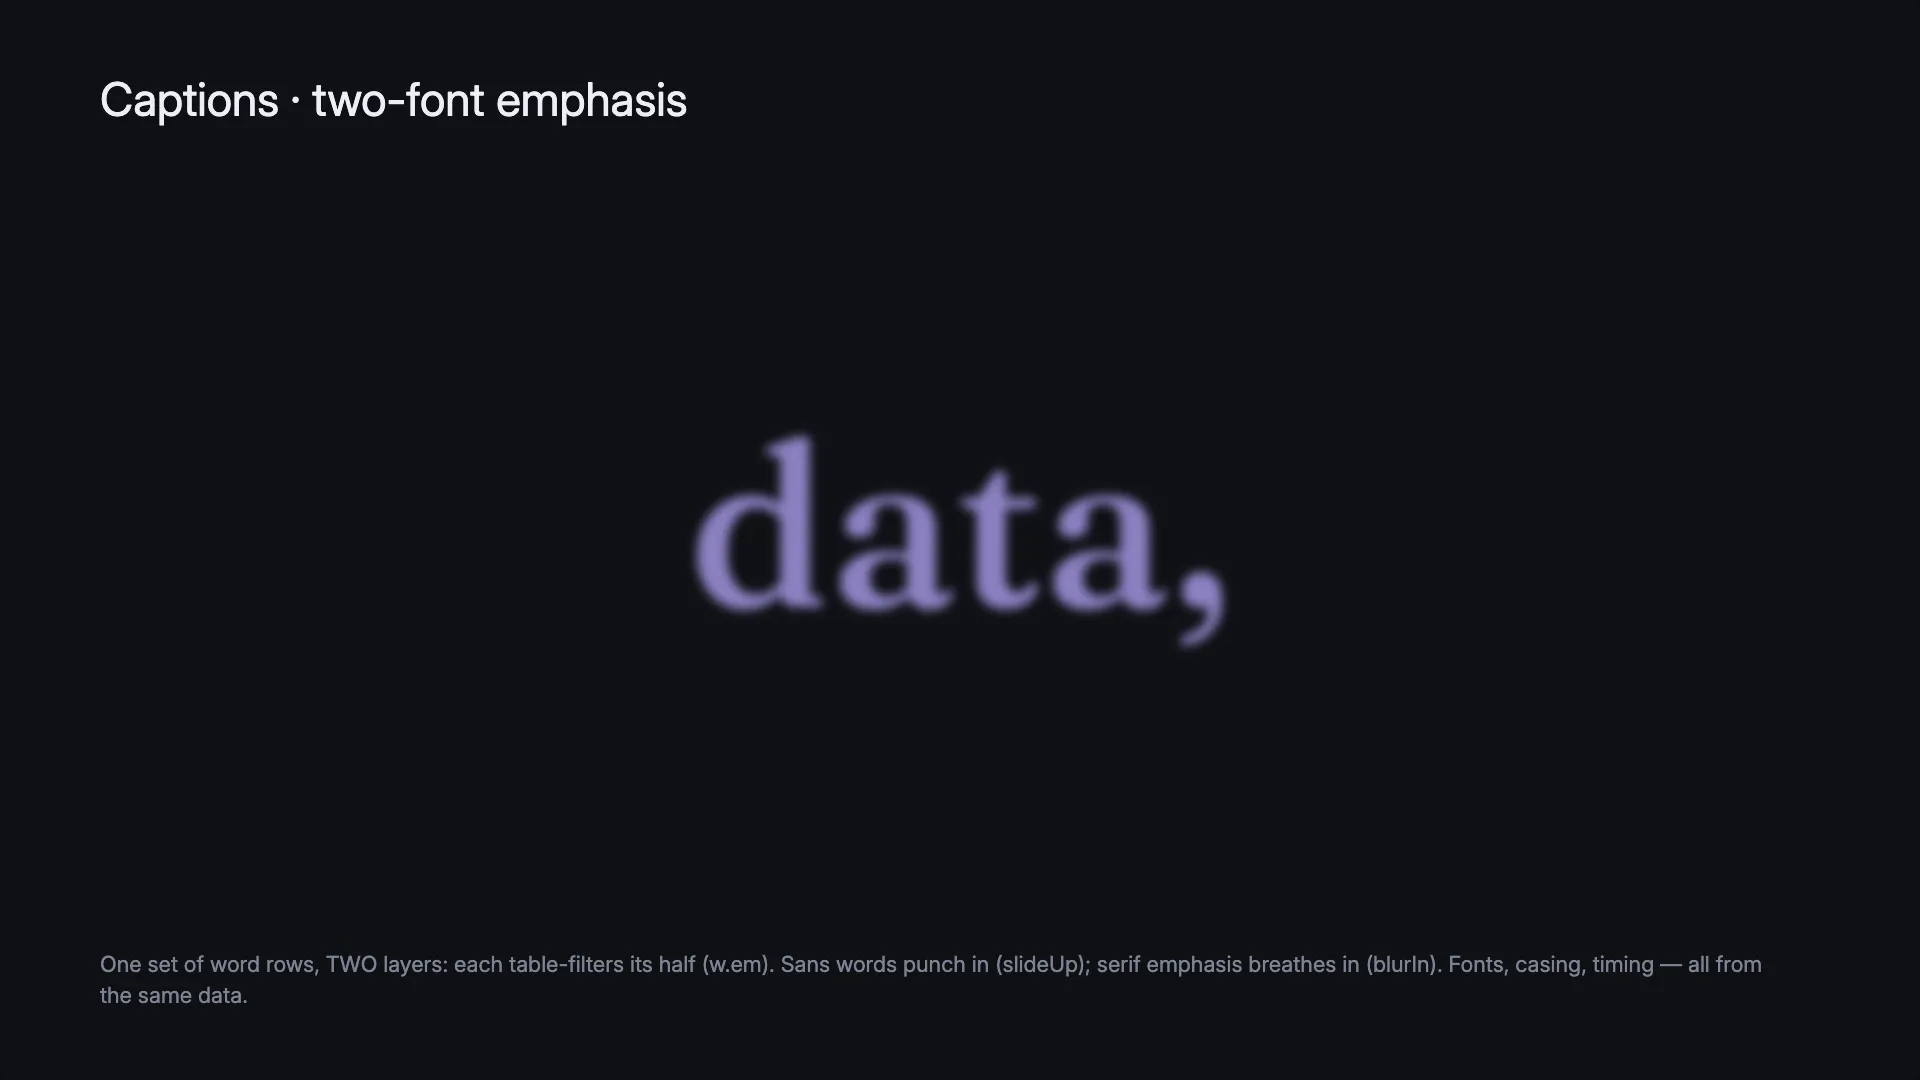
Mark the words that matter in the data (em: 1) and author two text
layers over the same rows — each filters to its half with the pipeline. The
plain layer is a bold uppercase sans that punches in; the emphasis layer is a
big coloured serif that breathes in with a blur. Same timing source, so the
two interleave perfectly — and making a word emphasised is a one-character
data edit.
The JSON behind it
// Layer 1 — plain words, Archivo 800, UPPERCASE, slideUp entrance"repeat": { "from": WORDS, "as": "w", "table": [{ "filter": "w.em = 0" }] },"bindings": {  "content": "= UPPER(w.word)",  "startTime": "= w.start", "endTime": "= w.end"}
// Layer 2 — emphasis words, Fraunces 500, larger, accent colour, blurIn"repeat": { "from": WORDS, "as": "w", "table": [{ "filter": "w.em = 1" }] },"bindings": {  "content": "= w.word",  "startTime": "= w.start", "endTime": "= w.end"}
WORDS is the same row set on both layers — inline rows or a dataset — with
each row shaped like { "word": "data,", "start": 1.15, "end": 1.75, "em": 1 }.
Countdown
Section titled “Countdown”No data at all: a text layer with a fixed count of 10, timing set to one
second apart, On screen set to One at a time, and its content bound to
= $count - $i. It reads 10, 9, 8… with each number holding for exactly one
second — the stagger is the counting speed. Swap the formula to = $i + 1
and it counts up instead.
The JSON behind it
{ "type": "text", "x": 960, "y": 540, "fontSize": 260, "fontWeight": 700, "textColor": "#eceef4", "repeat": { "count": 10, "stagger": { "each": 1 }, "arrangement": "oneAtATime" }, "bindings": { "content": "= $count - $i" }}Progress mapped to time
Section titled “Progress mapped to time”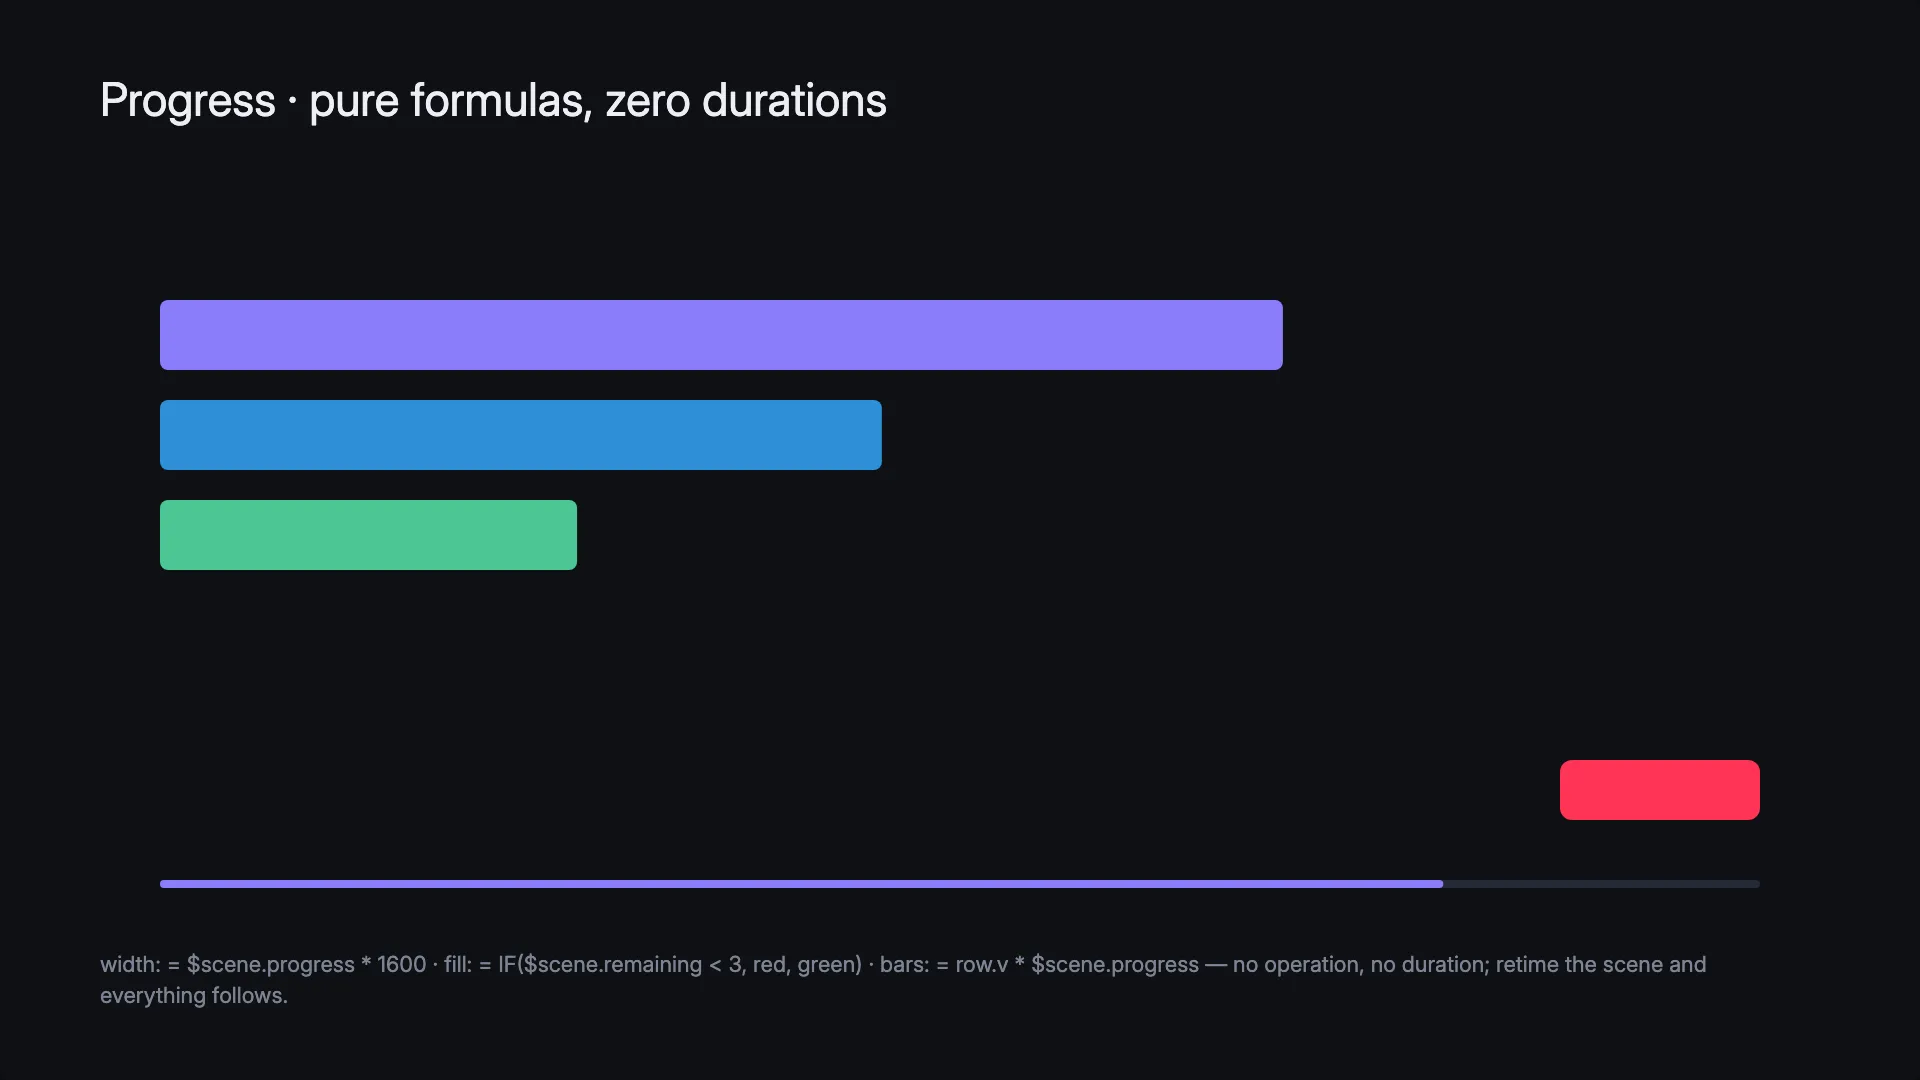
The simplest progress bar is one formula: bind the bar’s width to
$scene.progress — a number that runs from 0 to 1 over the scene, whatever
its duration becomes.
"bindings": { "width": "= $scene.progress * 1500" }No animation, no duration to keep in sync — trim the scene shorter or
stretch it longer and the bar re-times itself automatically. The same
clock powers colour logic (= IF($scene.remaining < 3, '#ff3355', '#1c7a55')
turns an element red for the final seconds) and mixes with data: on a
repeated bar, = row.target * $scene.progress sweeps every bar toward its
own value. Formulas can drive any numeric or colour property this way — not
text content.
Prefer animation instead? The classic patterns still work, and two of them remain animation-only:
- Ring — a circular path with the drawOn entrance, so the stroke draws itself around the circle. Entrance durations are plain numbers, so set the ring’s duration to match the scene length by hand.
- Stepped dots — a small circle repeated 8 times, offset in space and staggered one second apart; a colour animation on the template fires as each copy appears, so the dots light up one per second.
The stepped dots show the two systems composing: the repeat makes the dots, and any animation on the template is copied to every dot and shifted by its stagger — you never animate copies individually.
Both routes are valid: the formula owns the property outright and adapts to any scene length; the animation patterns compose with easing and the wider motion system. Pick whichever reads better for the job.
The JSON behind the bar and the dots
The bar’s fill is a property operation on the scene. The duration is an anchor, not a number — that’s what makes it re-time with the scene:
{ "kind": "property", "target": { "type": "layer", "layerId": "progress-fill" }, "property": "clipRight", "from": 100, "to": 0, "timing": { "start": { "type": "sceneStart" }, "duration": { "until": { "type": "sceneEnd" } } }, "easing": "linear"}The dots are a repeat plus one colour operation anchored to each copy’s own appearance:
{ "type": "rect", "width": 40, "height": 40, "cornerRadius": 20, "fill": "#242a38", "repeat": { "count": 8, "stagger": { "x": 120, "each": 1 } }}{ "kind": "property", "target": { "type": "layer", "layerId": "dot" }, "property": "fillColor", "from": "#242a38", "to": "#8b7dfb", "timing": { "start": { "type": "layerIn", "layerId": "dot" }, "duration": 0.2 }, "easing": "easeOut"}Audio-reactive graphics
Section titled “Audio-reactive graphics”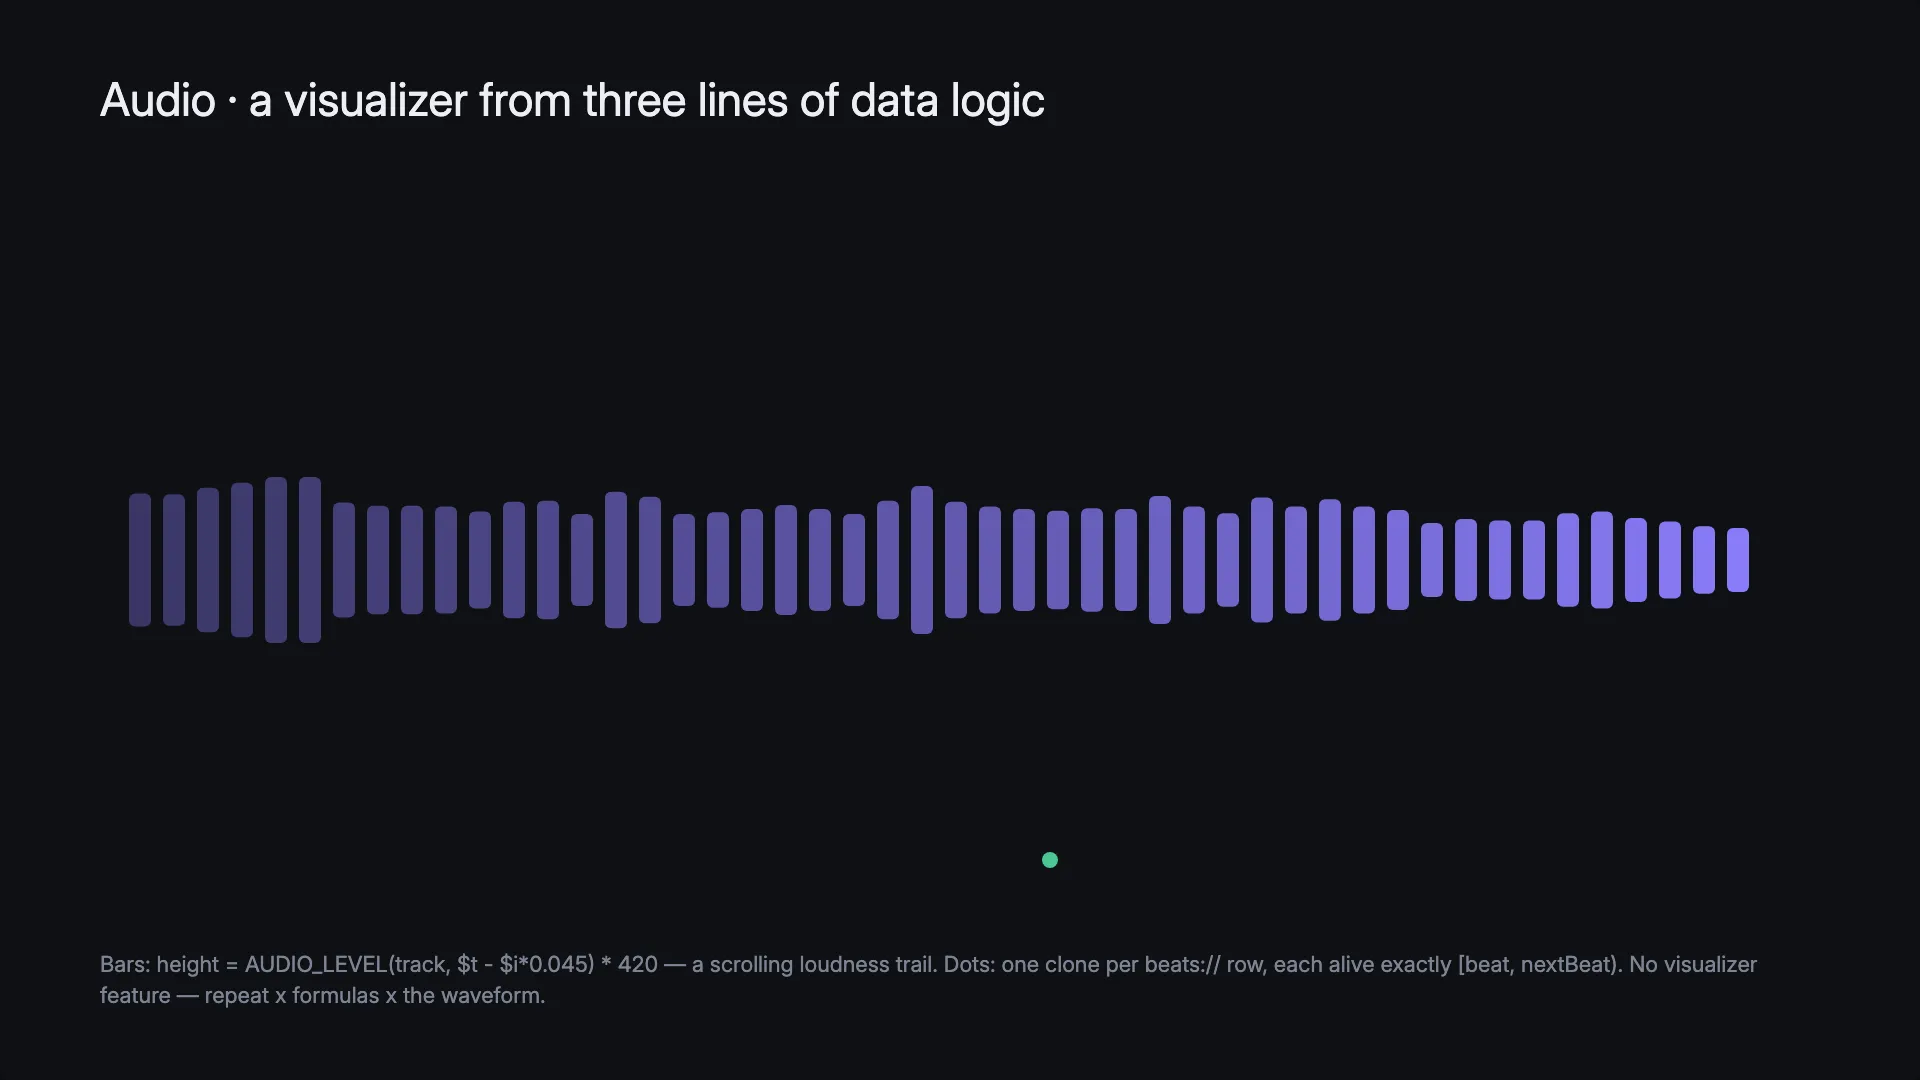
Audio is data too. Two doors:
AUDIO_LEVEL(track, seconds)reads the track’s loudness (0–1) at any moment — combine it with the scene clock and a repeat, and a fully custom visualizer is three lines: repeat a bar 48 times, thenheight: "= AUDIO_LEVEL(track, $t - $i * 0.045) * 420"— each bar reads the level slightly earlier than the last, so the whole strip is a scrolling loudness trail. Swap the formula for a VU meter, a pulse ring, a glow.- Beats become rows:
beats://gives one row per detected beat, with its interval — so a layer can exist per beat (a flash, a marker, a lyric card), not just animate on beats. Beat times follow the clip’s cuts the same way captions do.
Loudness only, honestly: a frequency-band spectrum analyzer (EQ bars dancing by pitch) needs analysis Mixture doesn’t store yet.
Formula cheat-sheet
Section titled “Formula cheat-sheet”Every function available inside a formula, by group:
| Group | Functions |
|---|---|
| Logic | IF, AND, OR, NOT, COALESCE, ISBLANK |
| Maths | ABS, ROUND, FLOOR, CEILING, SQRT, POWER, MOD, MIN, MAX, SUM, AVERAGE, COUNT |
| Motion & geometry | CLAMP, LERP, SCALE |
| Text | CONCAT, LEN, UPPER, LOWER, TRIM, LEFT, RIGHT, TRUNCATE, JOIN, CONTAINS |
| Formatting | TEXT, CURRENCY, PERCENT, DURATION |
| Randomness | RAND(seed) — deterministic, so renders are identical every time |
Operators follow spreadsheet conventions: = compares, <> is not-equal,
& joins text, plus the usual + - * / % and < <= > >=. Aggregates take
the row set and a column: SUM($rows, 'revenue').
A few that earn their keep:
= CURRENCY(row.revenue, 'GBP', 'en-GB') → "£1,200,000"= PERCENT(row.revenue / SUM($rows, 'revenue'), 1) → "51.1%"= DURATION(95) → "01:35"= TRUNCATE(row.name, 12) → "Q3 Enterpri…"= COALESCE(row.name, 'Unknown') → fills blanksBring your own AI
Section titled “Bring your own AI”Everything on this page is also documented to agents. Connect a coding agent to a project — see Work with agents — and the live documentation it fetches covers the whole data system: repeat, bindings, formulas, the row pipeline, datasets, and transcript captions.
Which means you can skip the JSON entirely and just ask:
- “Turn this CSV into an animated leaderboard bar chart.”
- “Add captions that follow my cuts.”
- “Repeat this card over the top five rows, sorted by revenue.”
The agent already knows the system; you review the result on the canvas.
Limits, honestly
Section titled “Limits, honestly”- 500 copies per repeat, 2,000 per scene across all repeats (nested repeats multiply, so a 100 × 100 grid won’t render in full).
- Formulas are not code. There are no loops, no custom functions, and no network access — only the whitelisted functions above. Row-set work (filtering, sorting, ranking) belongs to the pipeline, not to formulas.
- Frame formulas drive numbers and colours — not text. A formula reading
$scene.progressor$tre-evaluates every frame (that’s the progress pattern above), but text content can’t change per frame, and a formula owns its property outright — it overrides any animation on the same one. - A wrong column name shows as zero, not an error.
row.revenuquietly yields nothing, which draws a zero-width bar. If a bar vanishes, check the column name first — the binding picker in the editor lists the real ones, which is the easy way to avoid this.